Fabricante de estações de trabalho robóticas personalizadas e sistemas a laser


ROI de uma célula de soldagem robótica sem programação: Um guia prático para aplicações em aço estrutural
A maioria dos artigos sobre ROI de soldagem robótica fornecem uma fórmula e permitem que você mesmo preencha os números. Este não. We work through three complete structural steel scenarios — a medium-volume job shop, a high-volume production fabricator, and a transformer tank manufacturer — with cost estimates based on current system pricing , benchmark cycle times, and realistic payback calculations. You can read the scenario closest to your operation and adapt the numbers to your situation.
The focus throughout is on no-programming robotic welding cells specifically — systems that use 3D laser scanning and autonomous trajectory planning to eliminate teach pendant programming. This distinction matters for ROI because the economics of a no-programming cell are fundamentally different from a traditional programmed cell: the programming cost line disappears, the viable batch size drops to one, and the part mix constraint is removed entirely. These are not marginal improvements to the standard calculation; they change which shops automation is viable for.
If you are not yet familiar with how no-programming robotic welding cells work, ler Blogue 03: Célula de soldagem robótica sem programação first. This article assumes you understand the technology and are now evaluating whether the economics work for your operation.

A note on pricing:
system costs vary significantly based on configuration (solteiro vs.. dual station, tipo de posição, trilha do sétimo eixo, carga útil do sensor, and region-specific installation and commissioning requirements). System costs in this article range from approximately $48K for a single-station configuration to $204K for a fully-equipped large-part system with seventh-axis track and positioner. These are illustrative benchmarks intended for directional ROI estimation. Actual pricing depends on your specific part geometry, volume de produção, sensor payload requirements, e condições de instalação regionais. Para uma cotação específica do site, contact our engineering team with your part specifications and production volume.
The Four Numbers That Drive Every Welding Automation ROI
Before working through the scenarios, it is worth establishing the four variables that determine ROI in every structural steel welding automation calculation. Everything else is derived from these four.
| Variável | What it captures | Where to find your number |
| Taxa de mão de obra carregada (eu) | Salário do soldador + benefícios + employer overhead. The true hourly cost of employing a certified welder, not just the wage rate. | HR / payroll: wage rate × 1.25–1.40 typically covers benefits and overhead in most markets |
| Manual hours per part (H) | Total welder time per part: configurar, virando, soldagem, moagem, retrabalhar. Not just arc time — total hours from part arrival to completed weld. | Time your best welder on a representative part, including all non-arc time |
| Tempo de ciclo do robô por peça (C) | Tempo de verificação + geração de caminho + weld execution + part change. Includes all time the cell is occupied per part. | Request a cycle time study from the vendor on your representative part |
| Total cell investment (EU) | Equipamento + instalação + fixação + comissionamento + first-year maintenance budget. Not just the equipment price. | Get a fully-installed price from the vendor; add 15–20% for fixturing and commissioning |
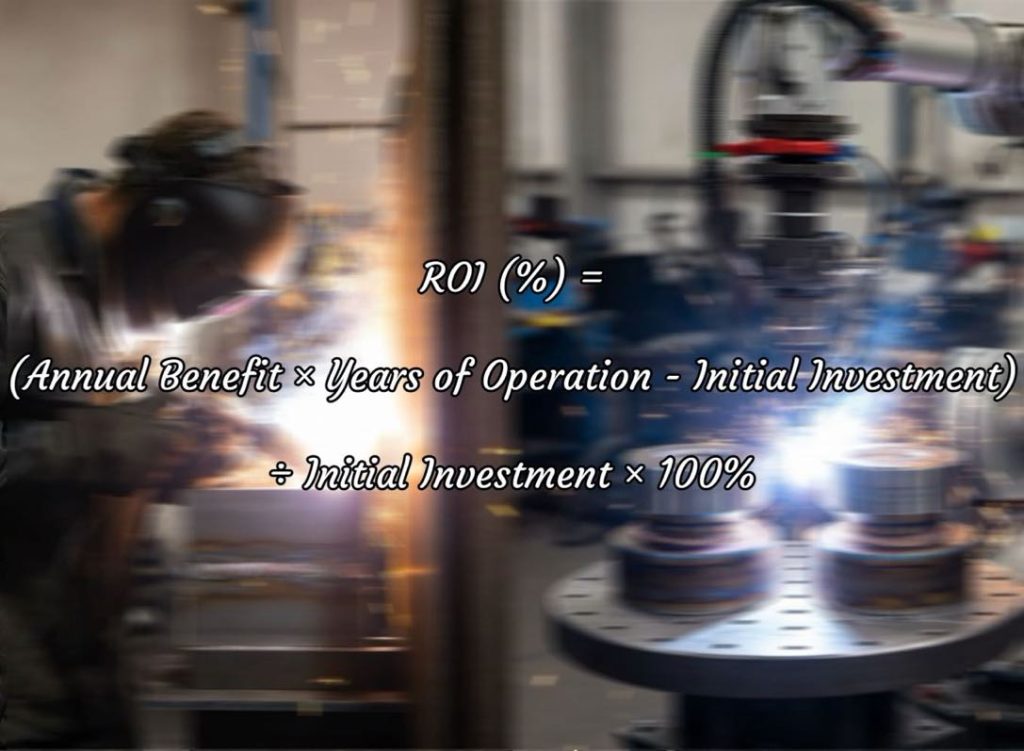
The ROI formula is straightforward once you have these four numbers:
| Monthly saving = V × [ (L × H) - (L × 0.15 × C + operating cost per part) ] Retorno (meses) = I ÷ Monthly saving Where: V = monthly part volume L × 0.15 × C = operator cost at 15% of cycle time (carregando, monitoramento, unloading) Operating cost per part = power + consumíveis + maintenance amortised ≈ $1.50–$3.00 Observação: Para uma célula sem programação, there is no programming cost term — that line is zero. For a traditional programmed cell, add: (programmer hours per part × programmer rate) to the robot cost side. |
Cenário 1: Medium-Volume Structural Steel Job Shop
Shop profile
| Parâmetro | Valor |
| Operation type | Job shop — project-based structural fabrication |
| Monthly part volume | 120 peças por mês, 25–30 different part numbers |
| Typical part | Beam bracket assembly — 4-sided fillet weld, 200–350 mm legs, 8–12 mm plate |
| Current workforce | 3 certified welders + 1 ajustador |
| Ponto de dor primário | Cannot find a 4th welder; losing orders due to capacity constraint |
| Cell being evaluated | Single-station vision-guided cell with positioner, no 7th axis |
The cost calculation
| Entrada | Valor | Fonte / basis |
| Taxa de soldador carregado (eu) | $54/hr | $38/hr wage × 1.42 burden rate |
| Manual hours per part (H) | 1.6 horas | Timed on representative bracket: 25 min setup + 52 min welding + 19 min grinding/rework |
| Tempo de ciclo do robô por peça (C) | 0.48 horas | Vendor cycle study: 8 min scan+plan + 21 min weld + 6 min load/unload |
| Cell investment (EU) | $48K–$80K | Estimated system cost: single-station vision-guided cell with positioner (configuration-dependent) |
| Volume mensal (V) | 120 peças | Current confirmed order book |
| Operator cost per part | $54 × 0.15 × 0.48 = $3.89 | 15% of cycle time at welder rate (redeployed as operator) |
| Operating cost per part | $2.10 | Power + arame + pontas + manutenção amortizada |
O resultado
Manual cost per part: $54 × 1.6 = $86.40
Robot cost per part: $3.89 + $2.10 = $5.99
Economizando por peça: $86.40 - $5.99 = $80.41
Monthly saving: 120 × $80.41 = $9,649
Período de retorno: approximately 5–9 months (depending on final system configuration)
| 5–9 monthsPayback period — Scenario 1 Medium job shop, 120 parts/month, $54/hr loaded rate (ilustrativo) |
Two additional value items not in the base calculation: the shop’s capacity constraint (turning away orders due to welder shortage) is estimated at $180,000 in lost annual revenue. At 3× throughput per shift with the cell, this constraint is eliminated in the first year — adding significant value that does not appear in a pure cost-savings ROI calculation.
Cenário 2: High-Volume Structural Fabricator with Repeat Production
Shop profile
| Parâmetro | Valor |
| Operation type | Production fabricator — supply chain component for construction contractor |
| Monthly part volume | 380 peças por mês, 8–12 active part numbers |
| Typical part | Column base plate assembly — T-joint and fillet welds, 16–25 mm plate, 2–4 weld joints per part |
| Current workforce | 5 welders on 2 shifts |
| Ponto de dor primário | Labour cost is primary margin pressure; want to reduce headcount through attrition |
| Cell being evaluated | Dual-station vision-guided cell with positioner — simultaneous load/weld |
The cost calculation
| Entrada | Valor | Fonte / basis |
| Taxa de soldador carregado (eu) | $61/hr | $44/hr wage × 1.39 burden (union shop) |
| Manual hours per part (H) | 0.95 horas | Timed: 12 min setup + 34 min welding + 11 min handling |
| Tempo de ciclo do robô por peça (C) | 0.28 horas | Vendor cycle study: 4 min scan+plan + 8 min weld + 5 min dual-station changeover |
| Cell investment (EU) | $80K–$140K | Estimated system cost: dual-station vision-guided cell with positioner (configuration-dependent) |
| Volume mensal (V) | 380 peças | Contracted production schedule |
| Operator cost per part | $61 × 0.15 × 0.28 = $2.56 | |
| Operating cost per part | $2.40 | Higher deposition rate on thick plate |
O resultado
Manual cost per part: $61 × 0.95 = $57.95
Robot cost per part: $2.56 + $2.40 = $4.96
Economizando por peça: $57.95 - $4.96 = $52.99
Monthly saving: 380 × $52.99 = $20,136
Período de retorno: approximately 4–7 months (depending on final system configuration and production volume)
| 4–7 monthsPayback period — Scenario 2 Produção em alto volume, 380 parts/month, $61/hr loaded rate (ilustrativo) |
No 380 parts per month and 2-shift operation, the dual-station cell runs approximately 1,800 hours per year. The cell effectively replaces 2.2 welders on an annualised basis — consistent with the shop’s attrition-based headcount reduction plan. One welder is redeployed as cell operator; one position is eliminated through natural attrition over 18 meses.
Cenário 3: Transformer Tank Manufacturer
Shop profile
| Parâmetro | Valor |
| Operation type | OEM transformer tank fabricator — 20–35 units per month |
| Monthly part volume | 28 transformer tanks per month — average 55 weld joints per tank |
| Typical part | Medium distribution transformer tank: 1.8 m × 1.2 m × 1.4 eu, 6–10 mm wall plate, corrugated side panels |
| Current workforce | 6 soldadores + 2 fitters — 2 shifts |
| Ponto de dor primário | Each tank is a different configuration — programming cost makes traditional robotics unviable |
| Cell being evaluated | Single-station vision-guided cell with 7th-axis track and headstock/tailstock positioner |
Why traditional robotics fails here — and why no-programming changes it
This scenario illustrates the core ROI difference between a traditional programmed cell and a no-programming cell. Com 28 tanks per month and 15–20 different configurations, a traditional cell would require 15–20 × 4 hours = 60–80 hours of programming per month at $90/hour — $5,400–$7,200 monthly in programmer cost alone, before the cell welds a single joint. The economics collapse before the analysis reaches payback period.
A no-programming cell eliminates this cost entirely. Each tank is scanned fresh; the path is generated autonomously. Programming cost is zero regardless of how many configurations the monthly batch contains.
The cost calculation
| Entrada | Valor | Fonte / basis |
| Taxa de soldador carregado (eu) | $58/hr | $41/hr wage × 1.41 burden |
| Manual hours per tank (H) | 19.5 horas | Timed across 5 representative tanks: soldagem + reposicionamento + moagem |
| Robot cycle time per tank (C) | 8.2 horas | Vendor cycle study: 18 min scan+plan + 7.2 hrs weld + 45 min positioner coordination |
| Cell investment (EU) | $140K – $ 204 mil | Estimated system cost: single-station cell with 7th-axis track and headstock/tailstock positioner (configuration-dependent) |
| Volume mensal (V) | 28 tanques | Current production schedule |
| Operator cost per tank | $58 × 0.20 × 8.2 = $95.12 | 20% of cycle time (heavier operator involvement for crane loading) |
| Operating cost per tank | $18.40 | Higher consumables on multi-pass thick plate joints |
| Programming cost saving | $6,300/mês | Eliminado: 70 hrs × $90/hr programmer — key no-programming advantage |
O resultado
Manual cost per tank: $58 × 19.5 = $1,131
Robot cost per tank: $95.12 + $18.40 = $113.52
Saving per tank (trabalho): $1,131 - $113.52 = $1,017.48
Monthly labour saving: 28 × $1,017.48 = $28,490
Monthly programming saving: $6,300 (unique to no-programming cell)
Total monthly saving: $28,490 + $6,300 = $34,790
Período de retorno: approximately 4–6 months (depending on final system configuration)
| 4–6 monthsPayback period — Scenario 3 Transformer tank OEM, 28 tanks/month, $58/hr loaded rate (ilustrativo) |
| The programming saving line ($6,300/mês) is exclusively a no-programming cell advantage.A traditional programmed cell in this scenario would add this cost rather than eliminating it,extending payback from 11 months to over 30 months — beyond most capex policy limits.This is why high-mix, non-repetitive structural steel applications are the strongest economiccase for no-programming cells specifically, not robotic welding cells in general. |
Four ROI Items That Traditional Welding Automation Models Miss
Standard ROI models capture labour savings. They typically miss four additional value items that are material to the total ROI of a no-programming robotic welding cell in structural steel applications.
| Missed item | Why it is real | Typical annual value |
| Revenue from unfilled capacity | Shops turning away orders due to welder shortage are losing revenue, not just incurring cost. The cell adds capacity without adding headcount. | $150K–$400K depending on order book and margin |
| Rework cost reduction | No-programming cells with gap-adaptive parameter control reduce rework from 3–8% to under 1% by adapting weld parameters to actual joint geometry. | $45K–$180K on $2M–$3M annual weld revenue |
| Recruitment and retention cost avoidance | Each welder hire costs $8K–$25K in recruitment, integração, and productivity ramp. Attrition reduction and headcount avoidance are real savings. | $16K–$50K per welder position avoided |
| Programming cost elimination | Traditional cells accumulate ongoing programming cost as part mix changes. No-programming cells have zero programming cost regardless of part mix. | $30K–$120K/year depending on mix complexity |
| When all four missed items are included, the total economic case for a no-programmingrobotic welding cell in structural steel fabrication is typically 40–80% larger than thelabour-saving-only calculation suggests. The payback period shortens correspondingly. |
Sensitivity Analysis: How Key Variables Affect Payback
ROI calculations are only as good as the input assumptions. The table below shows how the Scenario 1 payback period changes when key variables shift — giving you a sense of how robust the economics are to changes in your actual situation.
| Variable changed | From base case | Período de retorno (meses) | Direction |
| Taxa de soldador carregado | $54/hr → $45/hr (lower labour market) | 7–10 months | Longer |
| Taxa de soldador carregado | $54/hr → $65/hr (tight labour market) | 5–7 months | Shorter |
| Volume mensal | 120 peças → 80 peças (lower volume) | 8–12 months | Significantly longer |
| Volume mensal | 120 peças → 160 peças (higher volume) | 4–6 months | Shorter |
| Cell investment | $64K → $48K (lower spec / simpler configuration) | 4–6 months | Shorter |
| Cell investment | $64K → $180K (higher spec / estação dupla / large-part configuration) | 7–10 months | Longer |
| Manual hours per part | 1.6 hrs → 1.2 horas (simpler parts) | 9–13 months | Longer |
| Manual hours per part | 1.6 hrs → 2.2 horas (complex parts) | 4–6 months | Shorter |
| Include capacity revenue gain | Add $150K/year unfilled revenue | 3–5 months | Significantly shorter |
Two conclusions stand out from the sensitivity table. Primeiro, monthly volume is the most sensitive variable — dropping from 120 para 80 parts nearly doubles the payback period. The minimum viable volume threshold matters more than almost any other input. Segundo, including capacity-constrained revenue recovery compresses payback dramatically — because for shops that are already turning away orders, the cell is an enabler of revenue, not just a cost reducer.
Perguntas frequentes
What is the minimum monthly volume for a no-programming robotic welding cell to make financial sense?
Based on the scenarios above, the minimum viable volume for a standard single-station no-programming cell (investment typically in the $48K–$204K range depending on configuration) at a loaded welder rate of $50–$60/hour is approximately 70–90 parts per month with 1.5+ manual hours per part. Below this threshold, the monthly saving is insufficient to amortise the investment within a 48-month payback window. Shops below this volume are better served by semi-automated fixtures or positioners until volume grows. Shops near the threshold should run their own numbers with their actual labour rate and part complexity before deciding.
How do I calculate the loaded labour rate for my welders?
The loaded labour rate is the total annual cost of employing a welder divided by their annual billable hours. Total annual cost includes: base salary, payroll taxes (typically 7–10% of salary), health and dental insurance, retirement contributions, trabalhadores’ compensation insurance, and any other benefits. Divide by approximately 1,800 para 1,900 annual hours for a full-time welder. A welder earning $38/hour base wage typically has a loaded rate of $48–$55/hour depending on benefit structure. If you are uncertain, your HR or finance team will have this figure as part of their labour cost modelling.
The scenarios show labour savings, but how long does it take to see the first saving?
The first measurable saving appears in the first month of production operation — typically 8 para 16 weeks after order, once commissioning and operator training are complete. The cell begins producing parts immediately; there is no ramp-up period where it produces below capacity. The savings shown in the scenarios are achievable from month one of production operation, assuming the operator is trained and the weld schedule library is validated for the primary joint types. Some shops see partial savings in months one and two as the operator builds confidence, with full productivity reached by month three.
Should I include the cost of my current welder shortage in the ROI calculation?
Yes — and most standard ROI models do not prompt you to do this. If your shop is currently turning away orders or extending lead times because you cannot hire sufficient welding capacity, the lost revenue from those constraints is a real cost of not automating. To include it: estimate the annual value of orders you decline or defer due to welding capacity constraints, and add this figure as an annual benefit on the robot side of the calculation. This is not a speculative benefit — it is the recovery of revenue you are already failing to capture. Including it typically reduces payback by 30–50% for capacity-constrained shops.
Próximas etapas
If the scenarios above bracket your operation, you have enough information to take the conversation to the next level. Here is what to do:
- Run your own four inputs: loaded labour rate, manual hours per part, estimated robot cycle time, and total cell investment. The formula in H2-1 gives you a payback estimate in under 10 minutos.
- Request a vendor cycle time study on your representative part. Any credible vendor should be willing to provide a cycle time estimate based on your part drawings before you commit to a purchase. This gives you the ‘C’ variable with real data rather than a benchmark.
- Ask the vendor for a fully-installed price: equipamento + delivery + instalação + comissionamento + first-year maintenance contract. The gap between equipment price and fully-installed price can be substantial — installation, comissionamento, fixação, treinamento, and site-specific integration all add material cost. This is where ROI calculations most commonly go wrong.
- If you are a capacity-constrained shop, quantify your lost revenue before the vendor conversation. This number changes the ROI case significantly and gives you a stronger internal justification for the capital request.
| Leitura relacionada nesta série: Blogue 02 - Soldagem Manual vs Robótica para Aço Estrutural: Quando a automação compensa? Blogue 03 - Célula de soldagem robótica sem programação: Como os sistemas guiados por visão eliminam os pingentes de ensino Blogue 06 - Automação de soldagem de tanques de transformadores: Resolvendo o Desafio das Grandes, Partes Não Repetitivas Blogue 07 - Planejamento de trajetória autônoma em soldadores robóticos Blogue 09 - 5 Perguntas a serem feitas antes de comprar uma célula de soldagem robótica para aço estrutural |
| Get a Site-Specific ROI Assessment Tell us your monthly part volume, current labour rate, and typical part complexity. We will run a ROI model against your real numbers and return a payback projection — no commitment required. Contate-nos agora → Talk to an Engineer First ✓ No commitment required ✓ Response within 24 hours ✓ Free ROI projection |
Sobre o autor
Experiência & Credenciais
Especialista em integração de sistemas de soldagem robótica com 12+ anos de experiência direta em projetos focados na seleção e integração de posicionadores de robôs. Prestou consultoria para 300+ fábricas em toda a América do Norte, Europa, and Asia.
Histórico da empresa: 26+ anos de engenharia de automação de soldagem, 40+ patentes ativas, 1,500+ projetos concluídos globalmente, aproximadamente 70% envolvendo integração do Robot Positioner.
Certificações
- ISO 9001: 2015 (GB/T 19001-2016) — Sistema de Gestão da Qualidade
- GJB 9001C-2017 - Sistema de gerenciamento de qualidade de equipamentos militares/armas
- UE CE — Diretiva de Máquinas 2006/42/CE (Certificado. Não. M.2026.206.C134866)
- Empresa de alta tecnologia - Certificado. Não. GR202341000595 (Emitido em novembro. 2023)
Última atualização: junho 2026
POSTS RELACIONADOS
Análise ROI de soldagem robótica a laser: Vale a pena o investimento?
5 Perguntas a serem feitas antes de comprar uma célula de soldagem robótica para aço estrutural
Você pode confiar na folha de especificações? Como verificar a precisão do posicionador de soldagem com rastreadores a laser e ISO 9283
O guia completo para iniciantes em posicionadores de robôs: Tudo o que você precisa saber

6 Desafios comuns na soldagem robótica a laser e como resolvê-los