Custom Robot Workstations And Laser Systems Manufacturer


Manual vs Robotic Welding for Structural Steel:When Does Automation Pay Off?
The question is never whether robotic welding is better. The question is at what point the numbers change in your favour.
A skilled welder producing 60 structural brackets a month at a fully-loaded rate of $52 per hour is hard to beat on capital efficiency. The same shop trying to fill 400 orders a month — or trying to hire a second certified welder in a tight labour market — is a completely different calculation. This article works through that calculation for structural steel fabricators specifically, with real cost figures, a break-even framework, and an honest account of the situations where manual welding still wins.
New to the topic? Read Robotic Welding Cell vs Manual Welding: Which Is Better for Modern Manufacturing? — it covers the operational fundamentals before the economics.
How Manual and Robotic Welding Actually Compare
Start with the data. The table below covers the dimensions that matter for a structural steel fab shop — not automotive body panels, not precision sheet metal, but the real working conditions of beam fabrication, frame assemblies, and heavy weldments.
| Dimension | Manual welding | Robotic welding cell |
| Travel speed | 20–35 cm/min (skilled welder) | 60–120 cm/min MIG; up to 200 cm/min laser |
| Arc-on time per 8-hr shift | 25–35% (prep, positioning, breaks, fatigue) | 60–85% (automated positioner, minimal idle time) |
| Weld bead placement | ±1.5–3 mm variation, fatigue-dependent | ±0.1 mm repeatability, weld to weld |
| Spatter and rework rate | 3–8% rework typical on structural joints | < 1% with closed-loop arc monitoring |
| Setup time — new part number | 2–15 min (welder reads drawing, tacks) | 2–8 hrs traditional robot; < 5 min vision-guided |
| Throughput scaling | Linear — each extra welder adds fixed cost | Non-linear — second shift adds marginal cost only |
| Labour cost per metre of weld | $4–$9 (loaded rate, developed markets) | $0.80–$2.20 at 2-shift utilisation |
| Upfront capital | < $10K (equipment, consumables) | $80K–$500K+ (cell configuration dependent) |
| Typical break-even volume | Below ~80–100 parts/month | Above ~100–150 parts/month |
What the numbers mean in practice
Three rows in that table are worth slowing down on, because they drive most of the ROI calculation.
Arc-on time is the hidden productivity lever. A skilled manual welder spends roughly 65–75% of a shift on non-welding tasks: grinding, repositioning, reading drawings, waiting for the crane, tacking. A robotic cell with a positioner sustains 60–85% arc-on time because part handling and repositioning happen in parallel with welding. On a double shift, that gap compounds. A cell effectively provides the equivalent of 1.4–2× welder-hours for every shift hour it runs.
Setup time determines whether automation is viable for your part mix. Traditional robotic cells require 2–8 hours of teach-pendant programming per new part number. That makes them economical only at batch sizes of 30+ identical parts. Vision-guided, no-programming cells change this constraint entirely: the 3D scanner reads the actual weld seam geometry and generates the robot path in under five minutes. Single-part automation becomes viable. This is the technical shift that makes robotic welding practical for job shops — not just high-volume production lines.
Labour cost per metre of weld is the metric to track — not machine hourly rate. Buyers often compare robot depreciation cost per hour against welder cost per hour, which understates the robot’s advantage because it ignores arc-on time differential. At 75% arc-on time (robot) versus 30% (manual), the robot produces 2.5× more weld metres per clock hour. Calculate cost per metre of deposited weld, not cost per hour of machine time.
True Cost of Ownership: What Most Comparisons Miss
Most ‘manual vs. robot’ comparisons compare welder salary against robot depreciation. Both sides of that calculation are incomplete. Here is what actually goes into each option.
Hidden costs on the manual welding side
| Cost element | Typical annual impact |
| Welder recruitment and turnover | $8K–$25K per hire (agency fees, onboarding, productivity ramp) |
| Rework and weld repair | 2–5% of weld revenue — re-inspection labour, material, schedule delays |
| Fatigue-related productivity drop | Output falls ~15% in the second half of a shift — rarely modelled |
| Consumables waste | Spatter losses and excess wire burn-off run ~12% higher than robotic |
| Throughput ceiling | Cannot scale without hiring — hard constraint when welders are unavailable |
| Overtime premium | Surge orders met with 1.5–2× labour cost; robot’s marginal cost is near zero |
Hidden costs on the robotic cell side
| Cost element | Typical annual impact |
| Installation and commissioning | 15–25% of equipment cost, paid once |
| Fixturing and part-specific tooling | $10K–$80K — often the most underestimated line item |
| Programming labour (traditional cells) | $60–$120/hr for each new part number — ongoing, not one-time |
| Maintenance and consumables | 3–5% of capital cost per year (tips, liners, wire, robot service) |
| Unplanned downtime | $800–$2,500/hr in lost throughput — rarely appears in vendor proposals |
| Operator training and certification | $3K–$8K per operator for initial cell qualification |
| The programming labour line is the most variable cost in the robotic column. A traditionalcell in a job shop environment with frequent part changeovers can accumulate $50,000–$120,000 per year in programmer time alone. Vision-guided, no-programming cells eliminatethis line entirely — which changes the total cost of ownership calculation significantly forfabricators running more than 15 active part numbers. |
The Break-Even Framework: When Does Automation Pay Off?
The answer depends on four variables specific to your shop. Here is the framework, followed by a worked example using realistic structural steel figures.
The four variables
| Variable | How to measure it in your shop |
| Monthly weld volume (V) | Parts per month × average weld metres per part |
| Loaded labour rate (L) | Welder wage + benefits + overhead burden (typically $35–$65/hr total) |
| Cell capital cost (C) | Equipment + installation + fixturing — not just the equipment list price |
| Target payback period (P) | 24–48 months is typical for manufacturing capex in this category |
The break-even formula
| Monthly savings required = C ÷ P (where P is in months) Monthly savings = (Manual labour cost per month) − (Robot operating cost per month) = (V × L × manual_hours_per_part) − (V × robot_cost_per_part + maintenance) Solve for V to find the minimum monthly volume at which the cell pays back within your target period. |
Worked example: structural steel beam bracket
A mid-size fabricator is considering a $280,000 dual-station, vision-guided cell with positioner. They weld a 250 mm fillet joint on a four-sided beam bracket as their primary part.
| Input | Value used |
| Cell capital cost (C) | $280,000 (dual-station, vision-guided, positioner included) |
| Target payback (P) | 36 months |
| Monthly savings required | $280,000 ÷ 36 = $7,780 per month |
| Loaded welder rate (L) | $52/hour |
| Manual time per part | 1.8 hours (weld + tacking + repositioning) |
| Robot cycle time per part | 0.55 hours (including load/unload; 75% arc-on time) |
| Robot operating cost per part | $0.95 (power + consumables + maintenance amortised) |
| Labour savings per part | ($52 × 1.8) − ($52 × 0.2 operator time + $0.95) = $72.85 |
| Break-even volume | $7,780 ÷ $72.85 = 107 parts per month |
When Manual Welding Still Wins
This section matters as much as the break-even framework. Fabricators who trust this analysis are the ones who see that it gives honest advice, not a predetermined conclusion. There are real situations where manual welding is the right answer — and misidentifying them is an expensive mistake in either direction.
| Scenario | Why automation does not fit |
| Volume below ~80 parts/month | Capital cost cannot amortise over insufficient runtime hours |
| Deep restricted access — cavities < 200 mm | Robot torch physically cannot reach the joint |
| Exotic or highly variable alloys | Process development time per material makes automation uneconomical |
| One-off or prototype fabrication | Even vision-guided cells have setup overhead — not cost-effective for singles |
| Field welding and on-site repair | No fixed cell environment; manual skill is irreplaceable in the field |
| Very thick plate > 50 mm, multi-pass | Complex inter-pass management still benefits from welder judgement |
| Capital budget under $60K | No credible robotic cell for structural steel exists at this price point |

The hybrid reality: both methods coexist in most shops
The practical outcome in most structural steel fabricators that adopt automation is not replacement — it is redeployment. Robots handle the repeatable, high-volume joints. Skilled welders handle complex one-offs, repairs, joint geometries the robot cannot reach, and quality oversight.
A shop with four manual welders adds one robotic cell. Two welders become cell operators — higher-value roles with less physical fatigue. The other two continue manual welding on complex work. Total throughput increases by 2–3× with the same headcount. That is the realistic transition, not a scenario where welders disappear.
The workforce conversation is worth having early. Operators who understand that the cell handles the monotonous work and elevates their role tend to support the investment rather than resist it.
Structural Steel-Specific Factors That Change the Calculation
Generic welding automation comparisons miss the characteristics that make structural steel fabrication different from sheet metal or automotive applications. Each of these factors affects which cell configuration you need — and whether automation is viable at all.
| Structural steel characteristic | Impact on automation strategy |
| Part weight: 50 kg – 5,000 kg+ | Positioner payload rating is critical; overhead crane integration required |
| Fit-up gap variation: 1–4 mm common | Vision-guided seam tracking is not optional — it is a weld quality requirement |
| Joint access: beam flanges, stiffeners | 6-axis robot reach must be verified against worst-case joint geometry |
| Weld code compliance: AWS D1.1 / EN 1090 | Cell must log parameters per joint; traceability is a contract requirement in many sectors |
| Surface condition: mill scale, primer | Arc parameters must compensate — closed-loop power source preferred |
| High part mix in job shops | Vision-guided path planning is the economic enabler for frequent changeovers |
The fit-up gap problem — and why it is specific to structural steel
Structural steel cut tolerances are typically ±1–3 mm. Automotive stamped parts hold ±0.3 mm. That difference sounds small. In practice, it is the reason most traditional robotic cells fail in structural steel environments.
A traditional programmed cell follows a fixed path defined during teach-in. When the actual part sits 2 mm to the left of where the fixture places it — which happens every cycle with structural steel — the robot welds 2 mm off the joint centreline. Over a production run, that translates to inconsistent throat size, failed visual inspection, and rework rates that eliminate the productivity gain.
Vision-guided cells scan the actual joint geometry on every cycle. The path is generated from the real part, not the ideal model. Gap variation, angular deviation, and plate thickness tolerance are compensated in the path before the arc opens. This is not a premium feature for structural steel automation — it is the baseline requirement for acceptable weld quality under AWS D1.1 or EN 1090.
Which Choice Fits Your Shop?
Use this table to locate your situation before talking to any supplier. Not every outcome points toward automation — and identifying the wrong fit early saves everyone time.
| Your situation | Monthly volume | Labour context | Recommendation |
| Job shop, high part mix | < 80 parts | Any | Manual welding or semi-auto fixtures — revisit in 12 months if volume grows |
| Job shop, high part mix | 80–200 parts | Welder shortage | Vision-guided cell — break-even typically 24–36 months |
| Job shop, high part mix | 80–200 parts | Labour available | Hybrid: one cell for top-volume parts + manual for complex work |
| Repeat production, low mix | < 150 parts | Any | Evaluate traditional programmed cell or semi-auto positioner first |
| Repeat production, low mix | > 150 parts | Any | Robotic cell — strong ROI, 18–30 month payback typical |
| Large structural work — tanks, frames | > 50 parts | Any | Dual-station cell with 7th-axis track and positioner required |
| Practical note: Before any of this analysis is useful, you need one number — your current costper welded metre (labour + consumables + rework allocation). If you do not have it, calculateit before any supplier conversation. It takes about two hours with your production and financedata. Without it, you cannot measure what automation actually delivers. |
Frequently Asked Questions
At what production volume does a robotic welding cell become worth it?
For structural steel fabrication, the typical break-even volume for a $200K–$350K dual-station cell is 80–150 parts per month. The exact number depends on your loaded labour rate, part complexity, and target payback period. At $52/hour loaded cost and a 36-month payback target, the worked example above yields 107 parts per month. Shops in higher-labour-cost markets break even at lower volumes. Use the ROI template in Blog 08 to run your own calculation.
Can a small fabricator with five or fewer welders justify a robotic cell?
Yes, if volume and part mix align. A five-person shop running 120+ structural parts per month with repeatable geometry is a strong candidate. The limiting factor is usually not shop size but whether you can dedicate one person to cell operation. Vision-guided cells require minimal programming skill — an existing welder can be trained as cell operator in one to two weeks. The cell does not need to replace a welder to justify itself; it needs to add enough throughput to cover its cost.
Does a robotic cell eliminate the need for skilled welders?
No — and this framing causes the most unnecessary resistance to automation. Robotic cells remove the repetitive, physically demanding weld passes from skilled welders’ workloads. Welders are redeployed to complex joints, repairs, cell oversight, and quality inspection. In most shops, total welding headcount stays flat or drops by one position over time — not by the number of robots added. The work changes; the team largely does not.
How does welder shortage affect the automation decision?
Welder shortage is currently the fastest-growing driver of robotic welding adoption in structural steel. When you cannot hire the second welder you need, the opportunity cost of not automating is the revenue from orders you cannot fulfil — which often exceeds $200,000 per year in unfilled capacity. In this context, a $280K cell that enables 3× throughput with existing staff is not a cost centre question. It is a growth question.
Is robotic weld quality better than manual for structural steel?
On repeatability, yes. Robotic cells hold ±0.1 mm bead placement versus ±1.5–3 mm for manual welding. Under AWS D1.1 inspection — visual, UT, MT — robotic cells consistently pass at lower rework rates (under 1% versus 3–8% for manual production). For complex joints requiring judgement — irregular geometry, restricted access, unusual base metal conditions — an experienced manual welder can still outperform a robot on any single pass. The realistic answer is that robotic quality is more consistent; manual quality has a higher ceiling on difficult joints.
About the Author
Experience & Credentials
Robotic welding system integration specialist with 12+ years of direct project experience focused on Robot Positioner selection and integration. Has provided consulting to 300+ factories across North America, Europe, and Asia. All specification data in this article is drawn from actual H / B / L / U series product datasheets.
Company background: 26+ years of welding automation engineering, 40+ active patents, 1,500+ completed projects globally, approximately 70% involving Robot Positioner integration.
Certifications
- ISO 9001: 2015 (GB/T 19001-2016) — Quality Management System
- GJB 9001C-2017 — Military/Weapon Equipment Quality Management System
- EU CE — Machinery Directive 2006/42/EC (Cert. No. M.2026.206.C134866)
- High-Tech Enterprise — Cert. No. GR202341000595 (Issued Nov. 2023)
Last updated: Jun 2026
RELATED POSTS
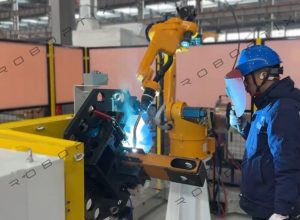
ROI of a No-Programming Robotic Welding Cell: A Practical Guide for Structural Steel Applications
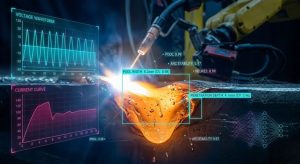
Robotic Welding Cell Trends 2026–2030: AI, Machine Vision & The Future of Welding Automation
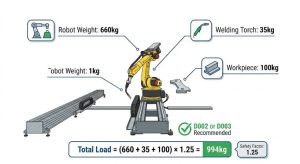
2026 7th Axis Robot Selection Guide: Payload, Stroke, Repeatability & Brand Compatibility
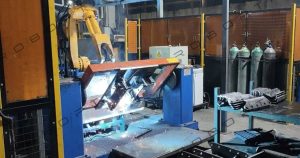
How a Welding Positioner Controls Gravity: The Physics of Puddle Stability and Weld Quality
2026 Welding Automation Pain Points: Why Competitive Factories Are Choosing a Robot Positioner