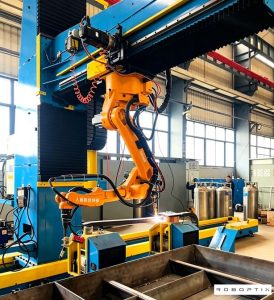
Производител на работни станции за роботи и лазерни системи по поръчка


ROI на позициите на робота: Колко всъщност ви струва ръчното заваряване?
| ⚠️ Pricing Disclaimer Prices shown are from a documented installation and are provided for illustration purposes only. Крайната цена се определя от спецификацията на проекта, изисквания за полезен товар, съвместимост на марката робот, и текущи разходи за материали — свържете се с нас за актуална оферта за проекта. |
Most factory owners know what a Позиции на роботи costs to buy. Very few know what manual welding is costing them to keep.
The repositioning time shows up nowhere on the income statement. The rework labor gets absorbed into overhead. The overtime hours are treated as a normal cost of doing business. The skilled welder who retired early because her back gave out is replaced with a recruitment fee and three months of reduced productivity — and that too disappears into the noise.
This article lays out the true cost picture of manual welding operations, the categories that most ROI conversations miss, and a real-world case study from an automotive Tier-2 installation — with every number independently verified.
| What this article covers: ① The five hidden costs of manual welding most shops undercount ② What a complete ROI picture actually includes — and what most models leave out ③ A worked example from an actual automotive Tier-2 installation — with every number verified ④ Three mistakes that make ROI calculations misleading |
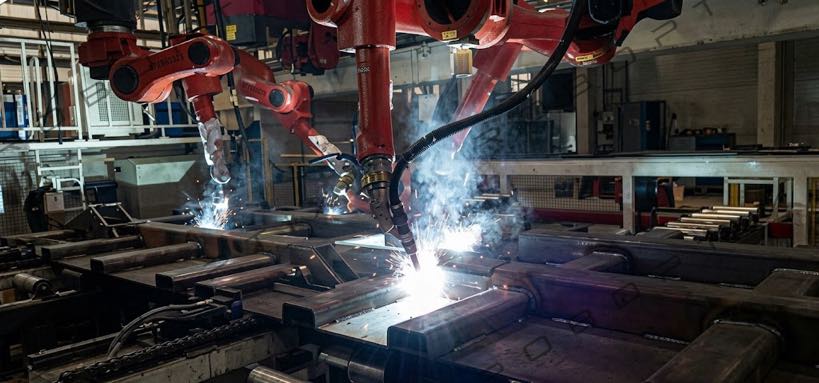
Част 1: The 5 Hidden Costs of Manual Welding
Before any ROI conversation is meaningful, you need an honest baseline. These five cost categories are consistently undercounted in the shops we assess — and together, they typically represent 35–55% of total welding labor cost.
Скрити разходи #1: Repositioning Time
In manual large-workpiece welding, welders spend less than 35% of their working hours actually welding. The rest is repositioning — waiting for the crane, rigging the sling, rotating the component, clearing the load, and getting back to position. In shops welding components above 500 кг, each repositioning event takes 15–25 minutes.
| What this looks like in practice: Across a standard two-shift operation, welders can end up paying for thousands of non-arc hours per year, per station — hours spent waiting and repositioning rather than welding. At a typical loaded labor rate, this routinely adds up to a six-figure annual cost in repositioning overhead alone, before a single weld defect or overtime hour is counted. |
Скрити разходи #2: Преработка и скрап
Weld quality in manual operations varies with the welder’s fatigue level, the shift, and the welding position. Joints executed in overhead or vertical positions carry 2–4× the defect probability of flat-position welds. Industry data across fabrication shops shows manual rework rates of 5–15% on audited welds, with each rework event costing 3–5× the original weld labor.
On a typical shop’s annual weld labor spend, even a moderate rework rate translates into tens of thousands of dollars in direct rework cost — plus material scrap, NDT re-inspection, schedule disruption, and the downstream cost of delayed shipments.
Скрити разходи #3: Overtime
When repositioning consumes the majority of shift time and production targets are set against 100% of shift time, the gap has to be made up somewhere. In most shops, it is made up with overtime. Overtime at 1.5× the base rate on the hours that should have been productive is one of the most expensive symptoms of repositioning inefficiency — and one of the most normalized.
Скрити разходи #4: Occupational Injury and Turnover
Overhead and vertical welding, combined with repeated crane-assisted load handling, generates musculoskeletal injury at a rate significantly higher than most industrial trades. The financial impact comes in three forms: работници’ compensation claims, early retirement of experienced welders (whose knowledge cannot be easily replaced), and the recruitment and training cost of the replacement.
Industry occupational health data consistently places experienced welder replacement costs at $15,000–$35,000 per departure when recruitment fees, onboarding productivity loss, and training time are fully accounted for.
Скрити разходи #5: Lost Revenue from Capacity Constraints
When a welding station runs at 35% arc-on time instead of 80%, the shop produces fewer units per shift than it could. For shops with a full order book, that gap is not a ‘waste’ issue — it is a revenue constraint. Every component that cannot be shipped on time because the welding station is the bottleneck represents margin that was not captured. This is rarely quantified, but it is often the single largest number in the full cost picture.
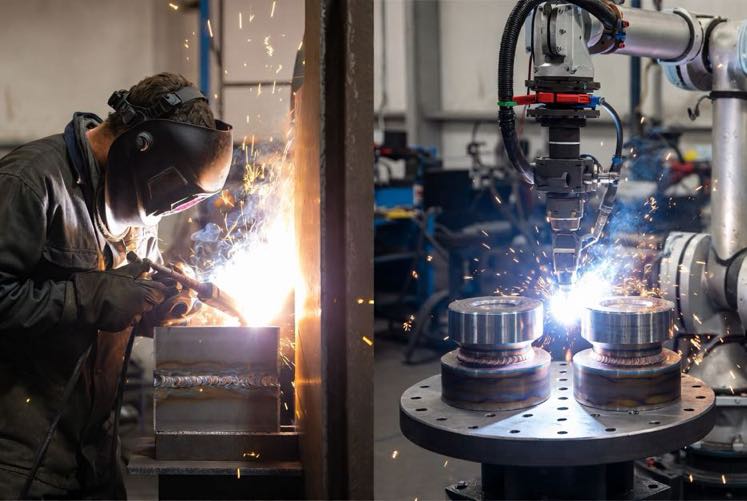
Част 2: What a Complete ROI Picture Actually Includes
Once the five hidden costs above are on the table, the ROI question changes shape. It’s no longer ‘what does the positioner cost’, but ‘what is the gap between what we’re paying now and what we’d pay after — and how fast does that gap cover the investment?’
A complete picture pulls together four cost categories that a Robot Positioner directly addresses:
- Repositioning labor — the non-arc time spent waiting, такелаж, and rotating workpieces manually
- Rework and scrap — the cost of correcting welds that didn’t meet quality standards the first time
- Overtime premiums — the extra-cost hours used to make up for lost productive time
- Welder recruitment and turnover — the cost of replacing skilled welders lost to injury or burnout
Based on documented post-installation audits across our installation network, these categories see substantial — and consistent — reductions once a Robot Positioner is in place:
| Разходна категория | Typical Reduction |
| Repositioning labor | ~85% |
| Преработка & скрап | ~80% |
| Overtime premium | ~60% |
| Welder turnover | ~50% |
| ⚠️ On payback period: The investment side of this equation depends entirely on your project specification — configuration, полезен товар, съвместимост на марката робот, and current material costs all factor in, and the correct figure includes far more than hardware list price (see Part 4). Rather than estimate this on generic numbers, our team can run the full calculation against your actual production data — see the custom analysis offer below. |
Част 3: Worked Example — Automotive Bracket Manufacturer
The following figures are drawn from pre- and post-installation records at a Tier-2 automotive supplier producing structural bracket assemblies. All financial figures have been independently verified. Investment figures reflect a specific historical project and are shown for illustration only.
| ⚠️ Pricing Disclaimer Figures shown are for illustration only. Pricing is project-specific — contact us for a quote based on your project specification, изисквания за полезен товар, and robot brand compatibility. |
Pre-Installation Baseline
Before installation, this station was operating with a 29% arc-on time — well below the 35% baseline typical of manual large-workpiece welding — alongside an 11.4% defect rate and significant overtime to compensate for lost productive hours.
Резултати след инсталирането (6-Month Average, Annualized)
| Метрика | преди | след | промяна |
| Време за включване на дъгата | 29% | ✅ 84% | +55 процентни пунктове |
| Общ процент на дефекти | 11.4% | ✅ 1.8% | −84% |
| Месечни разходи за труд за преработка | $5,586 | ✅ $842 | −$4,744/month |
| Overtime hours per month | 48 часове | ✅ 6 часове | −88% |
| Пропускателна способност (units/month) | 28 единици | ✅ 37 единици | +32% |
Results Summary — Verified
Across the four core cost categories — repositioning, преработвам, извънреден труд, and turnover — this installation produced a total identified annual saving of approximately $173,000, independently verified against arc-on audits, QC records, payroll data, and HR records.
Based on this client’s actual project investment, the simple payback period was 10.2 months on cost savings alone.
| Unquantified upside — throughput revenue: The 32% throughput increase was not included in the payback figure above. For this client, the additional production capacity translated to $185,000 in additional annual revenue, bringing true combined payback to approximately 6 месеца. Conservative recommendation: build your business case on the cost-saving payback alone, and present throughput revenue as additional validated upside. |
Част 4: 3 Mistakes That Make ROI Conversations Misleading
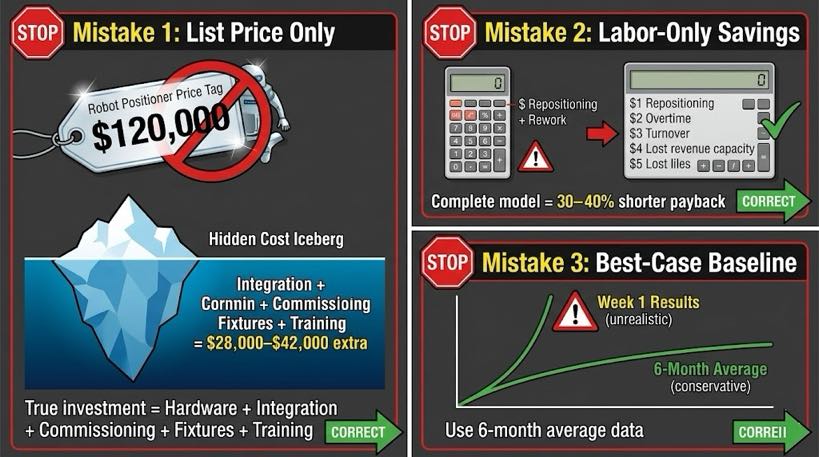
Грешка #1: Using Hardware List Price as the Investment Figure
The correct investment figure is: хардуер + integration engineering + въвеждане в експлоатация + fixture modification + обучение + резервни части + shipping and logistics.
In most projects, all non-hardware costs combined add 40–70% to the hardware price. A calculation based on list price alone produces an artificially optimistic payback period that the actual project will not match.
| Разходен компонент | Типичен диапазон | Бележки |
| Robot positioner hardware | Project-specific — request quote | Varies by configuration, полезен товар, destination |
| Integration engineering | $15,000–$30,000 | Механични, електрически, software |
| Въвеждане в експлоатация & тестване | $8,000– 15 000 долара | On-site 2–4 days |
| Fixture modification | $5,000– 15 000 долара | Workpiece-dependent |
| Обучение на оператор | $2,000–$5,000 | Included with standard packages |
| Резервни части (година 1) | $1,500–$3,000 | Серво задвижвания, cables, encoder |
| Доставка & logistics | $2,000–$5,000 | DDP pricing available to US/EU/AU |
Грешка #2: Only Counting Direct Labor Savings
Most ROI conversations capture repositioning labor and rework labor. They miss overtime premiums, turnover costs, insurance impact from safety improvements, and — most significantly — the revenue value of additional production capacity.
A complete four-category model typically produces a payback period 20–30% shorter than a labor-only model. A model that also includes throughput revenue can show payback 40–50% shorter than the labor-only baseline.
Грешка #3: Using Best-Case Post-Installation Numbers
Arc-on time improvement takes 4–8 weeks to stabilize after commissioning. Defect rate reduction takes 1–3 months as programs are tuned. A credible business case should be built on 6-month average post-installation data, not first-week results.
Основно правило: if the conservative case — with savings 20% lower than projected — still pays back in under 18 месеца, the investment is defensible to any stakeholder.
Want Us to Run the Numbers on Your Operation?
If you’d like to understand exactly what a Robot Positioner could mean for your specific operation, our engineering team will build a custom analysis using your real production data:
- Provide your current production volume, shift structure, labor rate, and rework rate
- We assess which cost categories — repositioning, преработвам, извънреден труд, turnover — represent your biggest opportunity
- We identify which Robot Positioner configuration produces the best results for your specific workpiece
- Written report delivered within 24 работно време, без никакви разходи
| Request a Custom ROI Analysis for Your Welding Operation No obligation. 24-hour response. Delivered as a written analysis based on your actual numbers. |
Често задавани въпроси
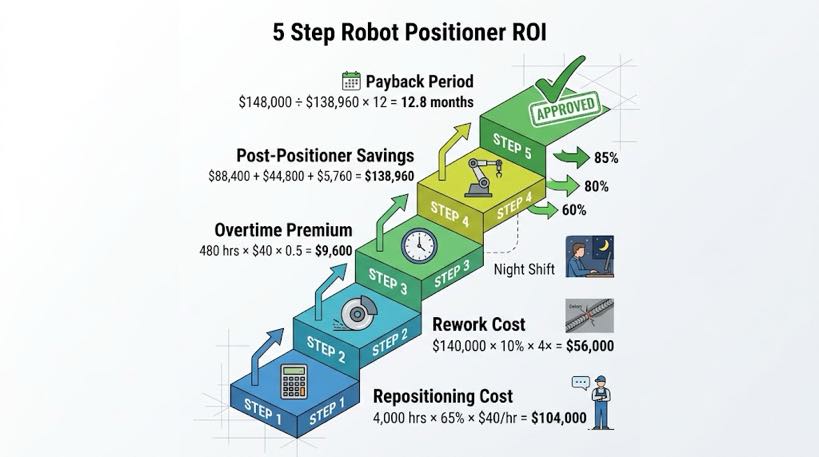
How do I calculate robot positioner ROI?
Start by quantifying your current annual costs across four categories: repositioning labor, преработка и скрап, overtime premiums, and welder recruitment/turnover cost. Then compare these against documented post-installation reduction benchmarks — typically 85% for repositioning, 80% for rework, 60% for overtime, и 50% for turnover — to estimate your potential annual saving. From there, divide your total project cost (not just hardware price) by the annual saving and multiply by 12 to get payback in months. For an accurate result based on your own numbers, our team can run this analysis for you at no cost.
What is a realistic robot positioner payback period?
Based on verified post-installation audits across 200+ deployments, most robot positioner installations achieve full payback in 6–18 months under normal production conditions. The automotive bracket case study documented in this article achieved payback in 10.2 months on cost savings alone, и приблизително 6 months when throughput revenue was included.
How much does a robot positioner project cost?
Project cost varies by product configuration, изисквания за полезен товар, съвместимост на марката робот, and current material costs. The hardware price alone does not represent the full investment — integration, въвеждане в експлоатация, приспособления, обучение, запазени, and logistics typically add 40–70% on top. Contact us for a project-specific quote: we provide a full line-item cost breakdown within 24 работно време.
What reduction percentages should I use for savings estimates?
The conservative benchmarks from our installation network are: repositioning labor 85%, преработка и скрап 80%, overtime premium 60%, and welder turnover 50%. These are 6-month average post-installation figures. For workpieces with simple geometry, results may be higher.
За автора
опит & пълномощията
Специалист по интегриране на роботизирана система за заваряване с 12+ години директен проектен опит, фокусиран върху избора и интегрирането на робот позиционер. Предоставя консултации на 300+ фабрики в цяла Северна Америка, Европа, и Азия. Всички спецификационни данни в тази статия са извлечени от действителните H / Б / Л / Продуктови листове с данни от серия U.
История на компанията: 26+ години инженеринг за автоматизация на заваряване, 40+ активни патенти, 1,500+ завършени проекти в световен мащаб, приблизително 70% включваща интеграция на Robot Positioner.
Сертификати
- ISO 9001: 2015 (GB/T 19001-2016) — Система за управление на качеството
- GJB 9001C-2017 — Система за управление на качеството на военно/оръжейно оборудване
- ЕС CE — Директива за машините 2006/42/ЕО (Серт. не. M.2026.206.C134866)
- Високотехнологично предприятие — Cert. не. GR202341000595 (Издадено ноем. 2023)
Последна актуализация: юни 2026
СВЪРЗАНИ ПУБЛИКАЦИИ
7th Axis Robot + Роботизирани позиционери: Изграждане на цялостни гъвкави клетки за заваряване
Стеснен бюджет, Интелигентен избор:Как малките и средни фабрики получават най-голяма стойност от робот-позиционер в 2026
Тенденции в роботизирана заваръчна клетка 2026–2030 г: AI, Машинно зрение & Бъдещето на автоматизацията на заваряването
Ръчно срещу роботизирано заваряване за структурна стомана:Кога автоматизацията се изплаща?
Как се образуват дефектите при роботизирано заваряване — и колко може да поправи роботът за позициониране?