Custom Robot Workstations And Laser Systems Manufacturer


How to Calculate Robotic Welding Cell ROI in 2026: Complete Template with Real-World Cases
How to Calculate This Investment?
“How much does a robotic welding cell cost? How long until payback?” These are the two questions every manufacturing decision-maker cares about most.
Article 3 answered the first question — initial investment of $35,000-110,000 in 2026. This article answers the second: How quickly will this investment pay back?
1. Direct Answer: 12-18 Months Payback, 150-250% 5-Year ROI
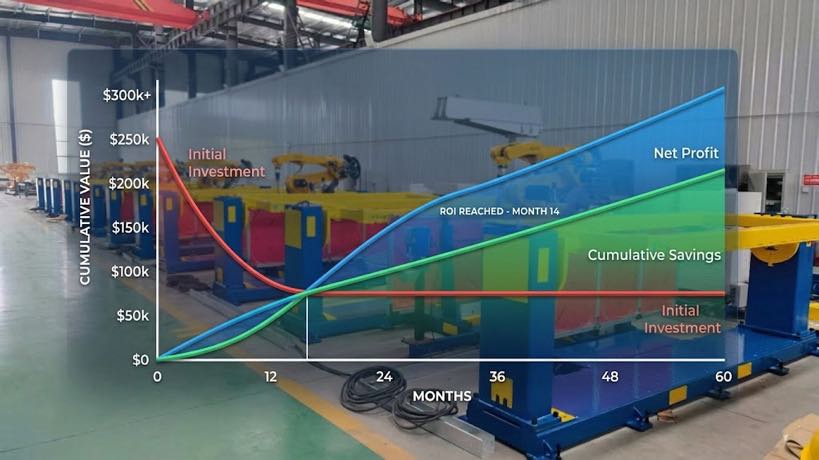
Based on financial tracking from 1000+ actual deployment projects, typical payback period is 12-18 months. High-performance cases (high utilization, high-wage regions) achieve 10-14 months. 5-year ROI ranges from 150-250%, and 5-year net profit is 1.5-2.5 times the initial investment.
Using a standard single-station ($70,000 total investment) as an example: total annual benefit of $42,000-60,000, payback period of 14-20 months, and 5-year net profit of approximately $180,000-320,000.
2. ROI Formulas
Basic Formulas
ROI (%) = (Annual Benefit × Years of Operation – Initial Investment) ÷ Initial Investment × 100%
Payback Period (months) = Initial Investment ÷ (Monthly Benefit – Monthly Operating Cost)
Total Annual Benefit Formula
Total Annual Benefit = Labor Savings + Productivity Gain + Rework Savings + Consumables Savings
Detailed benefit calculations: Labor savings equals welders replaced multiplied by welder salary minus operator salary. Productivity gain equals increased weld hours multiplied by hourly output value. Rework savings equals original rework rate minus new rework rate multiplied by annual units multiplied by rework cost per unit. Consumables savings equals wire and gas cost multiplied by savings percentage (typically 15-30%).
Input Variables Table (Fill in Your Data)
| Variable | Description | Your Data |
| Initial Investment | Equipment + Integration + Tooling + Training | _____ USD |
| Welders Replaced | Number of welders replaced by robot | _____ people |
| Welder Annual Salary | Including benefits, bonuses, overtime | _____ USD/year |
| Operator Annual Salary | Robot operator salary | _____ USD/year |
| Annual Weld Hours | Current manual welding hours | _____ hours/year |
| Original Rework Rate | Manual welding rework rate | _____ % |
| New Rework Rate | Robotic welding rework rate | _____ % |
3. Complete Investment Breakdown
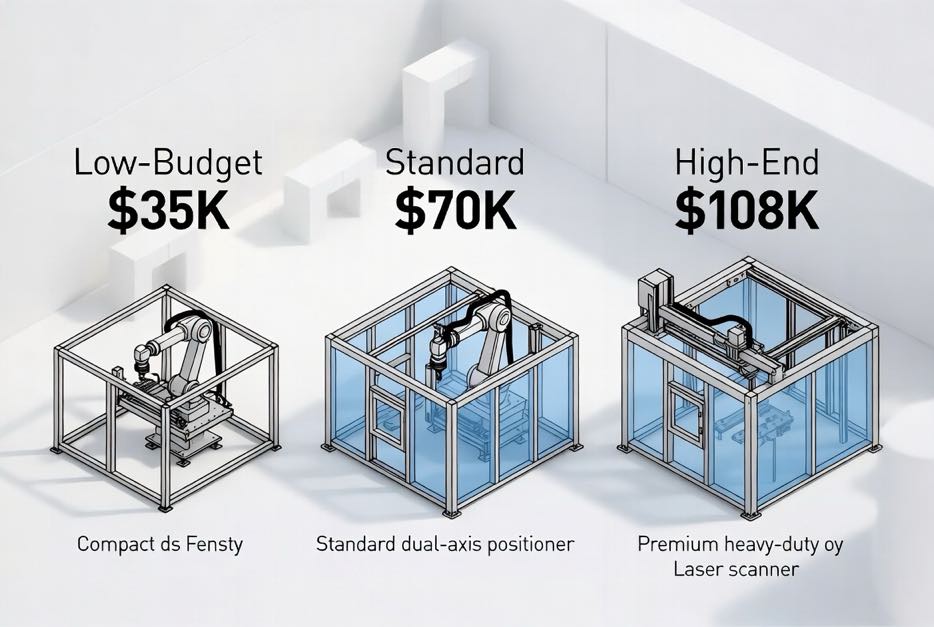
Initial investment for a robotic welding cell is distributed across six categories: robot arm, welding power source, positioner and tooling, safety and fume system, software licensing, and integration with training.
The low-budget solution (total $28,000-49,000) uses a domestic brand robot, domestic MIG welder, single-axis pneumatic positioner, simplified safety fencing and mobile fume extraction, with basic teach pendant software. The standard solution (total $54,000-83,000) uses an imported brand robot, imported pulse MIG welder, dual-axis servo positioner, fencing with light curtain safety system, and includes offline programming software. The high-end solution (total $83,000-118,000) uses a premium imported robot, high-end welder with CMT capability, heavy-duty dual-axis servo positioner, laser scanner with safety PLC, and full data collection capability.
Hidden costs to budget for include: tooling iteration ($1,500-4,000), trial welding and process development ($700-3,000), initial spare parts inventory ($400-1,100), and electrical and air line upgrades ($700-3,000).
4. Factors That Impact Payback Speed
According to sensitivity analysis, utilization has the largest impact on payback period — a 20% change in utilization causes a 25-35% change in payback period. Welder salary ranks second, with a 20% change causing a 15-20% change. Annual weld hours, initial investment, and consumables savings have smaller impacts.
Specifically, when annual weld hours decrease by 20%, payback extends from 14 to 18 months; when they increase by 20%, payback shortens to 11 months. When welder salary decreases by 20%, payback extends to 16 months; when it increases by 20%, payback shortens to 12 months. When utilization decreases by 20%, payback extends to 20 months; when it increases by 20%, payback shortens to 10 months. When initial investment decreases by 20%, payback shortens to 11 months; when it increases by 20%, payback extends to 17 months.
Key conclusions: Higher utilization means faster payback — two-station is 20-30% faster than single-station. High-wage regions (US, Western Europe) pay back 30-50% faster than low-wage regions. A 20% higher initial investment only extends payback by about 20%, but delivers higher long-term returns.
5. Complete ROI Calculation Cases for Three Business Types
Case 1: Small Metal Furniture Shop (Low-Budget Solution)
This company produces 8,000 parts annually (square tube frames) with 3 original welders and approximately 1,800 annual weld hours. Their investment: domestic 6-axis robot plus domestic MIG welder plus single-axis positioner plus basic fencing. Initial investment: $39,000. Annual operating cost: ~$3,500.
Benefit calculation: Labor savings of $12,000 (replacing 1.5 welders at $18,000 each minus operator at $15,000). Productivity gain of $8,000 from 2.5x efficiency. Rework savings of $3,200 (rework rate from 8% to 3%, 8,000 parts at $8 per rework). Consumables savings of $1,600 (original $8,000/year at 20% savings). Total annual benefit: $24,800.
Results: Payback period of approximately 19 months, 5-year net profit of approximately $85,000, and 5-year ROI of 218%.
Case 2: Mid-Sized Automotive Parts Supplier (Standard Solution)
This company produces 35,000 parts annually (subframes and brackets) with 8 original welders (two shifts) and approximately 4,000 annual weld hours. Their investment: Fanuc robot plus Lincoln pulse welder plus dual-axis servo positioner plus safety fencing plus offline programming. Initial investment: $72,000. Annual operating cost: ~$6,000.
Benefit calculation: Labor savings of $35,000 (replacing 2.5 welders at $22,000 each minus operator at $20,000). Productivity gain of $15,000 from 3x efficiency. Rework savings of $6,825 (rework rate from 9% to 2.5%, 35,000 parts at $3 per rework). Consumables savings of $3,750 (original $15,000/year at 25% savings). Total annual benefit: approximately $60,575.
Results: Payback period of approximately 14 months, 5-year net profit of approximately $250,000, and 5-year ROI of 347%.
Case 3: Large Construction Machinery Manufacturer (High-End Solution)
This company produces 12,000 parts annually (buckets and structural parts) with 12 original welders (three shifts) and approximately 6,000 annual weld hours. Their investment: Yaskawa robot plus Fronius welder plus heavy-duty dual-axis positioner plus fully enclosed safety system plus MES integration. Initial investment: $108,000. Annual operating cost: ~$10,000.
Benefit calculation: Labor savings of $60,000 (replacing 4 welders at $25,000 each minus 2 operators at $40,000 total). Productivity gain of $35,000 from 3.8x efficiency. Rework savings of $15,600 (rework rate from 7% to 1.8%, 12,000 parts at $25 per rework). Consumables savings of $6,000 (original $20,000/year at 30% savings). Total annual benefit: approximately $116,600.
Results: Payback period of approximately 11 months, 5-year net profit of approximately $530,000, and 5-year ROI of 491%.
Three Cases Comparison Summary
| Comparison | Case 1 (Small Furniture) | Case 2 (Mid-Sized Auto) | Case 3 (Large Machinery) |
| Initial Investment | $39,000 | $72,000 | $108,000 |
| Annual Benefit | $24,800 | $60,575 | $116,600 |
| Payback Period | 19 months | 14 months | 11 months |
| 5-Year Net Profit | $85,000 | $250,000 | $530,000 |
| 5-Year ROI | 218% | 347% | 491% |
6. ROI Calculation Excel Template
Our Excel calculator includes six sheets: Input Variables Sheet for entering your shop’s data; Investment Cost Sheet that auto-summarizes equipment, integration, tooling, and training costs; Annual Benefit Sheet that auto-calculates labor, productivity, rework, and consumables savings; Payback Chart that auto-generates a payback period curve; 5-Year Cash Flow Sheet showing year-by-year net profit; and Sensitivity Analysis Sheet that auto-updates payback period when variables are adjusted. Reply “ROI Template” to download.
7. Frequently Asked Questions
Regarding payback speed, the fastest recorded payback is 8 months — a high-volume automotive parts supplier operating three shifts with 92% utilization and high welder wages. In worst-case scenarios (utilization below 50%, low-wage regions), payback may extend to 24-30 months, but 99% of projects achieve payback within 3 years.
Regarding used robots, they cost 40-60% of new prices, typically achieving payback in 8-12 months. However, verify controller version, spare parts availability, and safety compliance — these may impact long-term operating costs. An independent integrator should conduct a condition assessment.
Regarding leasing (RaaS) models, monthly lease costs $1,100-2,100 with no initial investment. Annual operating cost equals 12 months of lease plus consumables. Payback period doesn’t apply — consider the model if annual net benefit is positive.
Regarding maximizing ROI, five key measures are: increase utilization (two-station achieves 85-95%); train operators in basic programming to reduce integrator wait time; optimize fixture design to reduce changeover time; use pulse MIG process to reduce spatter and grinding time; and build a welding parameter library for quick recall of proven settings.
Complete your ROI calculation in three steps: Step 1 — Fill in the input variables table (welders replaced, welder salary, annual weld hours, etc.); Step 2 — Select your investment solution (low budget/standard/high-end), and total annual benefit auto-calculates; Step 3 — Review payback period and 5-year ROI to make your decision.
Remember the core formula: Payback Period (months) ≈ Initial Investment (USD) ÷ Total Annual Benefit (USD) × 12. Typical value: $70,000 ÷ $50,000 × 12 = 16.8 months.
If you have your shop’s data ready, share the following information for a free preliminary ROI calculation: current number of welders and annual salary level; annual weld hours or annual production volume; main products and welding processes; and your region (welder salary varies significantly by region).
Recommendations for Action
International Federation of Robotics (IFR) – World Robotics Report
American Welding Society (AWS) – Welding Workforce Data
Financial tracking data from 1000+ robotic welding cell deployment projects (2024-2026)
Related Reading
– What Is a Robotic Welding Cell? A Beginner’s Guide
– How Much Does a Robotic Welding Cell Cost in 2026? Full Price Analysis
– 10 Key Benefits of Implementing a Robotic Welding Cell in Your Shop
– How to Choose the Right Robotic Welding Cell? Single-Station vs. Two-Station
Author Identification
This article is based on the International Federation of Robotics (IFR) World Robotics Report 2025, American Welding Society (AWS) workforce data.
Author:
An expert in robotic welding system integration with over 12 years of industry experience. My company has over 26 years of professional experience, holds more than 40 patented technologies, and has successfully completed over 1,500 projects worldwide (approximately 70% of which involved robotic welding cells, totaling more than 1,000 units). The company holds EU CE certification (Certificate No.: M.2026.206.C134866) and complies with the EN 60204-1:2018 and EN ISO 12100:2010 standards. I have assisted numerous manufacturing companies throughout the entire process of robotic welding workstation implementation, from selection to production launch.
Updated: May 2026
RELATED POSTS
Robotic Welding Cell Programming for Beginners: Step-by-Step Guide 2026
How a Welding Positioner Controls Gravity: The Physics of Puddle Stability and Weld Quality
Welding Positioner for Sale: How to Choose the Right Type for Your Part (Headstock Tailstock, L-Type, U-Type, Horizontal 3-Axis, Single Axis Rotary, Vertical Tilting)
Fixture-Free Fabrication: When a Welding Positioner Replaces Complex Jigs, Tack Welds, and Crane Time
How to Install and Integrate a 7th Axis Robot: Step-by-Step Guide & Best Practices